-
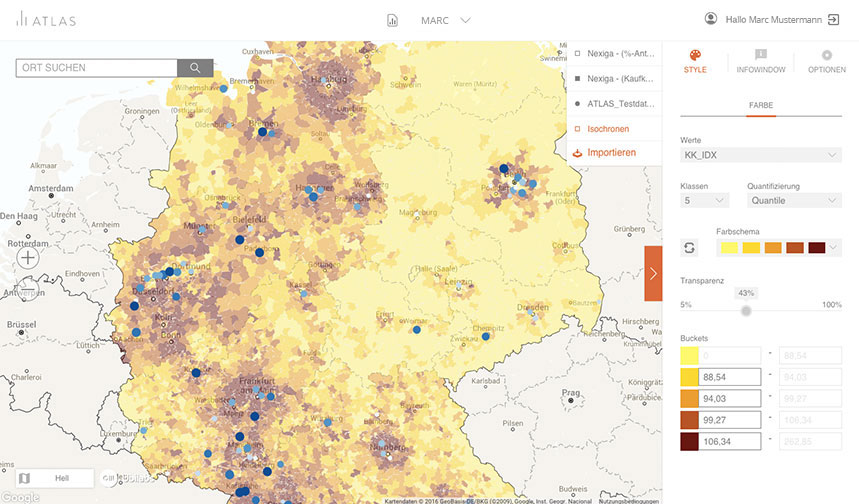

Purchase power combined with the sample stores locations (Source: Ubilabs/ATLAS) -
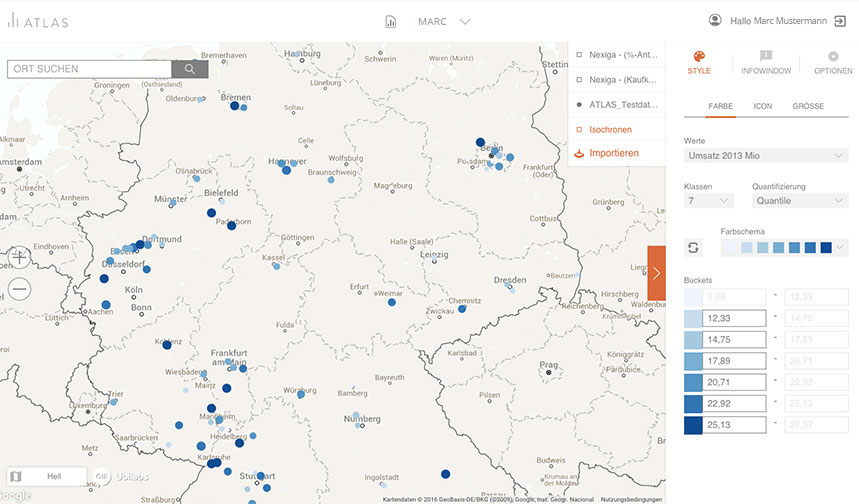
The revenue of sample stores sorted by colors visualized in ATLAS (Source: Ubilabs/ATLAS) -
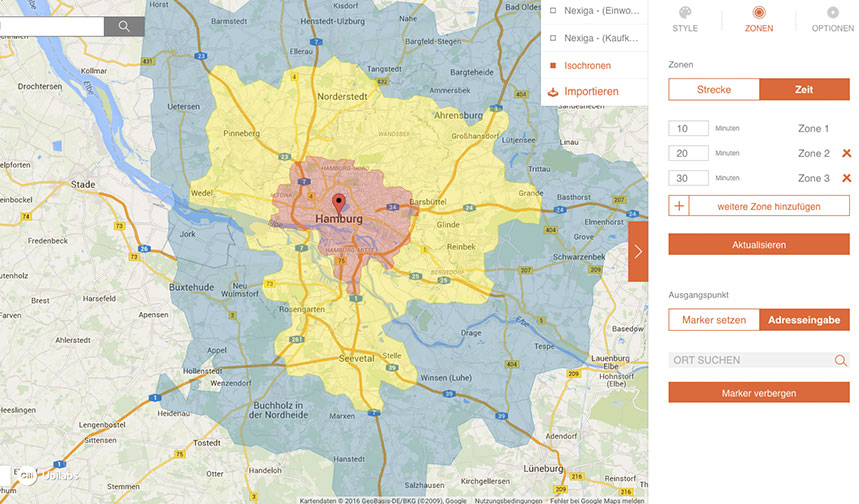
ATLAS' new feature – Drive time zones in Hamburg calculated and visualized with ATLAS (Source: Ubilabs/ATLAS) -
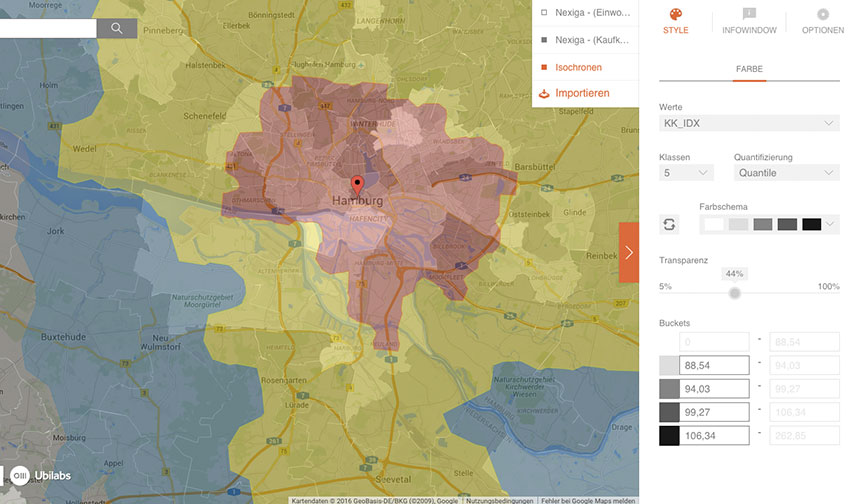
ATLAS' new feature – Drive time zones combined with the purchase power in Hamburg (Source: Ubilabs/ATLAS)


Location Intelligence with ATLAS: From Raw Data to Powerful Images
Let’s imagine you sell children’s bicycles. You want to open a second store because your business constantly grows – how would you proceed? How can you find the best location for your business? On what criteria do you base your decision? Get supported by our location intelligence tool ATLAS, and learn more about its newest feature.
What to do with your data? Spice it up!
Think about analyzing complex tables and long lists. Your eyes hurt and the brain tries to process as much information as possible. But what information remains, what will be stored? The human brain can capture visual representations much faster than words and numbers. Why work through never-ending tables if you can understand correlations easily at a glance? This is how the location intelligence tool ATLAS will help you.
Sound decisions based on drive-time zones
Let’s assume you sell children’s bicycles in Hamburg. Your store makes every child’s dream come true – and it is performing perfectly well. Therefore you want to open up a second store and you think about the major questions: Where should it be located? Where does my target audience live? Which distance will they accept to visit the store? Maybe 20 minutes, or more? Use ATLAS’ drive time zones to map out acceptable travel distances to your location.
Uncover hidden potentials for your business
The drive time zones indicate an area which encloses all accessible streets which can be reached within a given running time from your location. The specified travel time or distance to your location can be entered individually as well as the number of the zones. And you will see your potential catchment area at a glance. That’s still not enough for a decision? Integrate further data, for example the purchasing power and age of the inhabitants – information, that is a fixed component of ATLAS. A comprehensive database for all relevant market information in Germany is provided by Nexiga. Display your stores and branches, the drive time zones combined with the purchase power and the age groups. Evaluate relevant areas, make informed decisions and assign marketing activities.
No geo knowledge? No problem!
This example demonstrates only one use case of ATLAS. Briefly, what are the major advantages of the location intelligence tool ATLAS?
ATLAS supports you to:
Classify territorial units on the basis of key business indicators and market data
Localise, categorize and visualize branch locations, customers, and competitors
Connect and analyze company figures and market data
Thanks to the user-friendly and intuitive surface, geography knowledge is not necessary. Identify new opportunities and potentials for your business and make informed market decisions.
ATLAS – harness the power of images
ATLAS is not limited to certain economic sectors. The application can be used individually for almost every use case in all sectors (for example: the air pollution project). The tool’s strength lies in easy handling and numerous application opportunities.
We all know that words disappear – and images remain. Find out what it means to take advantage of the power of images and request your free test account for ATLAS.